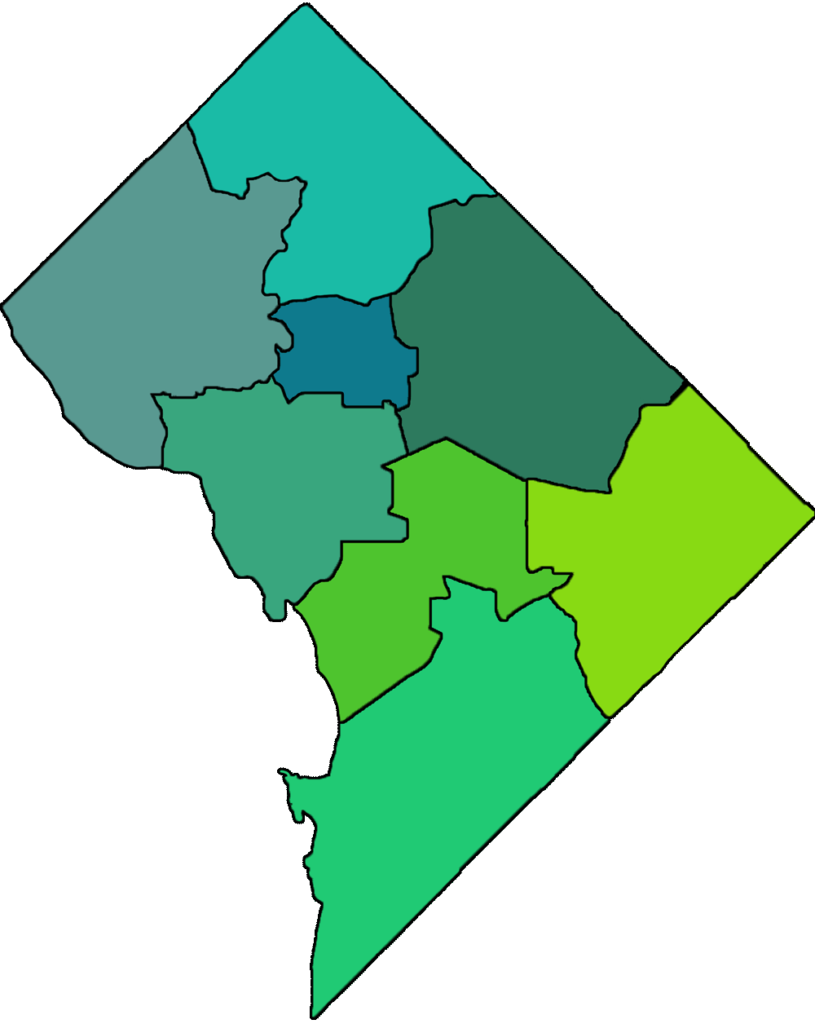
How do we advance Equity and Antiracism?

First, we look at data.

0
2020-21 DCPS Total Student Enrollment
BLACK STUDENTS
0%
HISPANIC / LATINX STUDENTS
0%
WHITE STUDENTS
0%
TWO OR MORE RACES
0%
ASIAN
0%
AMERICAN INDIAN / ALASKA NATIVE
0%
NATIVE HAWAIIAN / OTHER PACIFIC ISLANDER
0%
DCPS Student
Demographics Across Wards
Hover over the map to see a
demographic breakdown
of each DC ward.
1

Ward  1
American Indian / Alaska Native   0.14 %
Asian    2.56 %
Black   29.68 %
Hispanic / LatinX   51.95 %
Native Hawaiian / Other Pacific Islander    0.04 %
Two or More Races   2.29 %
White   13.33 %

2

Ward  2
American Indian / Alaska Native   0.15 %
Asian   10.21 %
Black   17.23 %
Hispanic / LatinX   33.43 %
Native Hawaiian / Other Pacific Islander    0.22 %
Two or More Races    5.70 %
White    33.06 %

3

Ward  3
American Indian / Alaska Native    0.19 %
Asian    7.09 %
Black    10.75 %
Hispanic / LatinX    13.82 %
Native Hawaiian / Other Pacific Islander    0.21 %
Two or More Races   7.67 %
White    60.28 %

4

Ward  4
American Indian / Alaska Native    0.16 %
Asian    1.31 %
Black   35.46 %
Hispanic / LatinX   43.21 %
Native Hawaiian / Other Pacific Islander    0.08 %
Two or More Races    2.74 %
White    17.03 %

5

Ward  5
American Indian / Alaska Native    0.14 %
Asian     0.93 %
Black    69.53 %
Hispanic / LatinX    23.84 %
Native Hawaiian / Other Pacific Islander    0.02 %
Two or More Races    1.07 %
White    4.47 %

6

Ward  6
American Indian / Alaska Native    0.07 %
Asian    2.32 %
Black    53.02 %
Hispanic / LatinX    7.40 %
Native Hawaiian / Other Pacific Islander   0.03 %
Two or More Races   5.80 %
White   31.37 %

7

Ward  7
American Indian / Alaska Native    0.13 %
Asian   0.20 %
Black    91.96 %
Hispanic / LatinX    6.06 %
Two or More Races    0.73 %
White    0.92 %

8

Ward  8
American Indian / Alaska Native    0.08 %
Asian     0.30 %
Black    93.76 %
Hispanic / LatinX    3.27 %
Native Hawaiian / Other Pacific Islander    0.10 %
Two or More Races    1.11 %
White    1.37 %

* Please note that this map reflects the wards where DCPS students call “home” and does not necessarily reflect where they attend school.​

We use data to identify needs and disparities.

RACE
Despite overall progress in achievement at District of Columbia Public Schools (as measured by the PARCC* and NAEP**) an opportunity gap between students of color and their white peers has persisted.

*Partnership for Assessment of Readiness for College and Careers **The National Assessment for Educational Programs (The Nation's Report Card)
Learn More
FAMILY RESPONSIBILITY
Approximately 10% of teenage students at DCPS are parents.
Learn More
DISABILITY
As of SY2019-20 93.4% of students identified with disabilities at DCPS were students of color.
Learn More
SEX ASSIGNED AT BIRTH
In SY2019-20, Black female students were suspended at a rate that is more than 4X their Latina peers and about 17x more than their white female peers.
Learn More
NATIONAL ORIGIN
More than 1 in 20 individuals residing in D.C. over the age of 5 is LEP/NEP.*

*LEP/NEP - Limited and non-English proficient.
Learn More
Previous slide
Next slide

Then we apply a comprehensive and adaptive Equity Lens across DCPS initiatives.

HOVER to READ more

CLICK TO ENLARGE

THIS MEANS Acknowledging
the historical and current context
of diverse stakeholders to create
an inclusive professional and educational culture.

Asset 91

THIS MEANS Reflecting on our
own identity, biases, privileges, and experiences, as well as how they
impact our beliefs and actions.

Asset 89

THIS MEANS Establishing policies and systems that promote equitable outcomes for marginalized groups.

Asset 90

THIS MEANS Learning and applying culturally responsive
and affirming practices in our
daily work and planning.

Asset 87